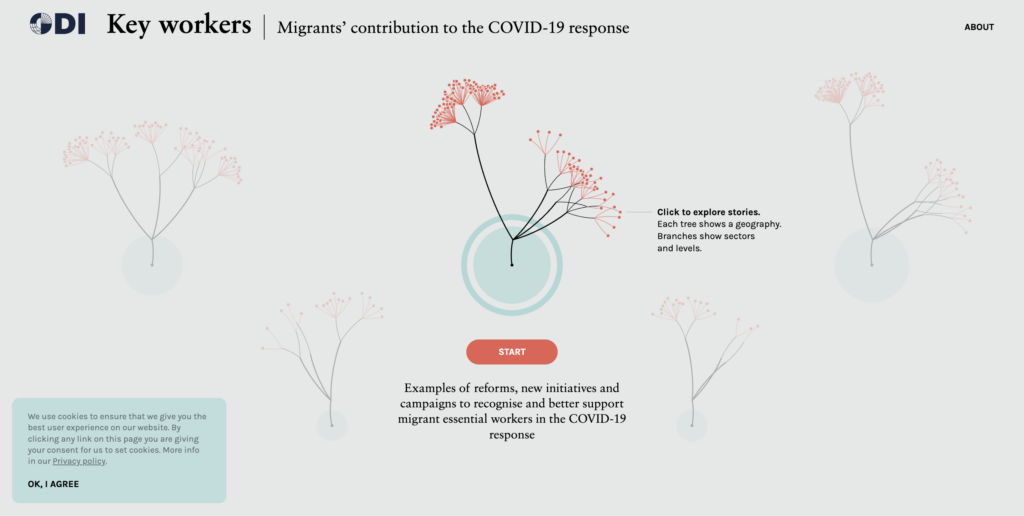
Migrants’ contribution to the COVID-19 response November 16, 2022 In Data Visualisation, Visual examples An interesting concept of Data Visualisation The Du Biosian Toolkit Related Posts Iconoclasistas (Argentina) DataVis Book Club, by Lisa Charlotte TED2019, the Brightline data experience Alexandra Bell, ‘Counternarratives’—Public work