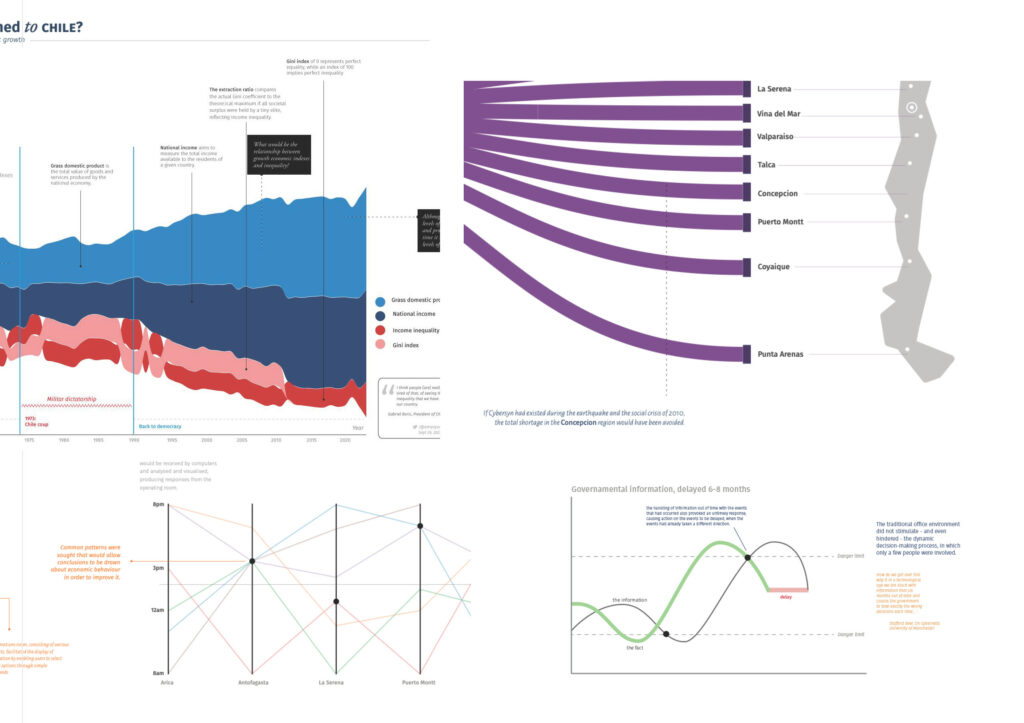
This series of exercises explored traditional ways of representing data, using the experimental Chilean project Cybersyn and its political-historical context as a set of narratives and sources of information. The aim was to generate stories and datasets that could be visualised in alternative ways.
Historical context
During the early 1970s, former Chilean president Allende implemented an economic policy that aimed to revive the country’s economy through public funds and nationalisation. A year later, the Cybersyn project was launched, which aimed to involve workers in data-driven economic planning. However, despite these efforts, the economy continued to decline, leading to a military coup in 1973 and a subsequent dictatorship. Although free-market reforms were later implemented and proved successful, Chile now has the highest levels of inequality among OECD countries following the Pinochet dictatorship.
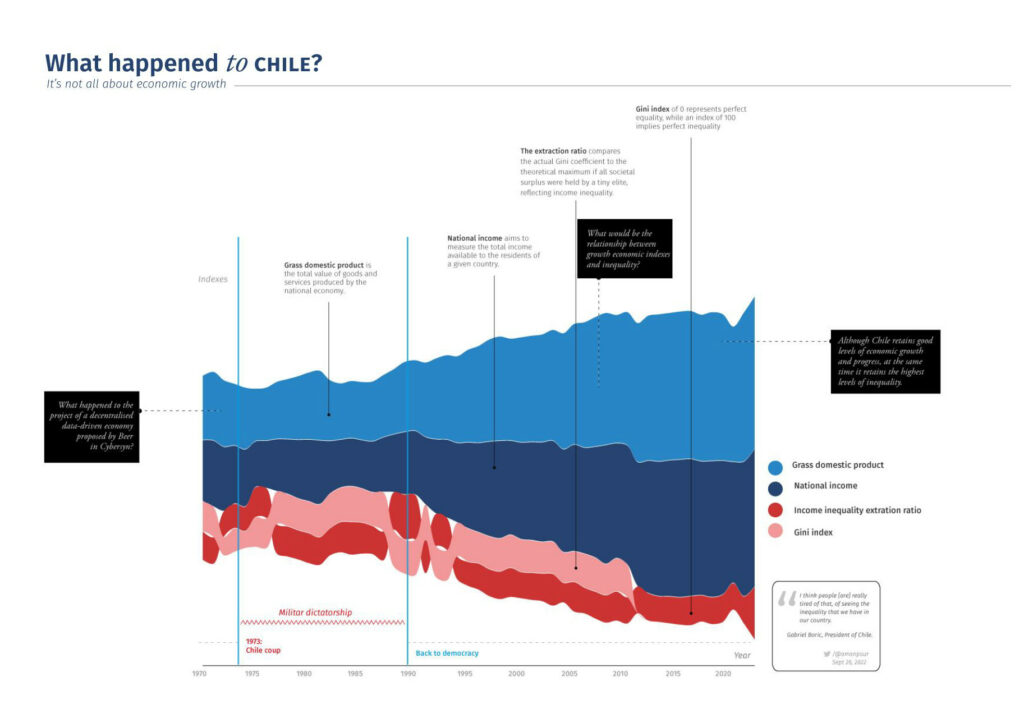
What happened to Chile?
This visualisation aims to highlight the disproportion between economic progress indicators and the indicators of inequality that are often ignored by the hegemonic powers. The data sources have been categorised into primary, secondary, and tertiary based on Kitchin’s (2016) classification. The researcher-practitioner’s reflections are considered primary data, the definitions of the indicators are secondary data, and some aggregated tweets from citizens expressing their opinions are considered tertiary data.
References
- Kitchin, R. 2016. Big Data. International Encyclopedia of Geography. pp.1-3. https://doi.org/10.1177/2043820613513388